
College football already has several competing ways to describe the same season, and those systems can reach very different conclusions from the same Saturday. The AP Poll reflects a national media consensus, the Coaches Poll reflects a panel drawn from current FBS head coaches, and the 135 Sports Top 30 is built as a predictive team strength ranking. Looking at all three together is useful because the disagreements often reveal more than the places where everyone reaches roughly the same conclusion.
The second full weekend of the 2026 season created exactly the kind of evidence that tests each approach differently, because several highly regarded teams either faced elite opponents or performed far differently from expectation. Texas came back to beat Ohio State by one point, Oregon lost at Oklahoma State, Michigan beat Oklahoma, and several teams farther down the national picture produced performances that forced voters and models to reconsider their positions. Those results reshaped both major human polls while also giving the 135 Sports framework another substantial collection of live evidence to evaluate. (AP News) This week also marks an important methodology change for the 135 Sports board, because the official rankings now use methodology 2026 v0.12 after a structured refinement process that began with last week's public 2026 v0.10 board.
The objective throughout that process was not to make the rankings resemble the AP Poll, reward particular teams, or force controversial placements into a more familiar order. Rather, the goal was to improve how a predictive strength ranking transitions from an audited opening view toward the football that teams are actually putting on the field.
AP Poll Heading Into Week 3
The AP Poll remains the most familiar national ranking in college football, and its structure is straightforward even when the judgments behind individual ballots remain subjective. The voting panel includes sportswriters and broadcasters from across the country, with each voter submitting a Top 25 ballot that awards descending points from first through twenty fifth place. The combined point totals create the weekly ranking, which makes the poll an organized national consensus rather than a single mathematical estimate of team strength. (AP News) The latest AP board reacted aggressively to the biggest Week 2 results, beginning with Texas moving from fourth to first after its comeback victory over previously top ranked Ohio State.
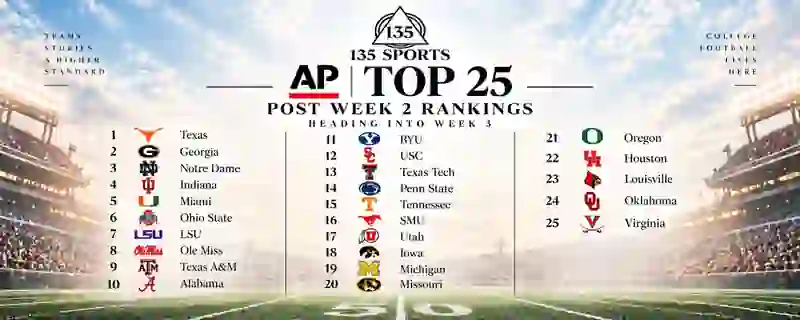
Ohio State fell from first to sixth, Oregon dropped from sixth to twenty first after losing at Oklahoma State, Michigan returned at nineteenth after beating Oklahoma, and Oklahoma fell from eleventh to twenty fourth. Washington dropped out despite remaining unbeaten, while Georgia, Notre Dame, Indiana, Miami, LSU, Ole Miss, Texas A&M, and Alabama filled the rest of the top ten behind Texas. (NCAA.com) That movement illustrates the basic character of a human consensus poll, because a major win or loss can change both the record and the broader story voters are trying to interpret. AP voters can weigh head to head outcomes, opponent quality, game performance, record, prior expectations, and whatever other football evidence they believe should influence their ballots. That flexibility gives the poll much of its value, but it also means the AP ranking is answering a broader question than a strict predictive strength model would ask.
Coaches Poll Heading Into Week 3
The Coaches Poll reaches its rankings through another human voting process, although the voting panel comes from inside the sport rather than from the media covering it. The FBS Coaches Poll uses a panel of head coaches selected across conferences and independent programs, with each coach submitting a Top 25 ballot that awards descending points from first through twenty fifth place. The combined ballots create another national consensus ranking, although the constituency behind that ranking differs substantially from the AP voting panel. (AFCA) The broad picture looks similar near the top, because the coaches also placed Texas first, Georgia second, Notre Dame third, Indiana fourth, Miami fifth, and Ohio State sixth.
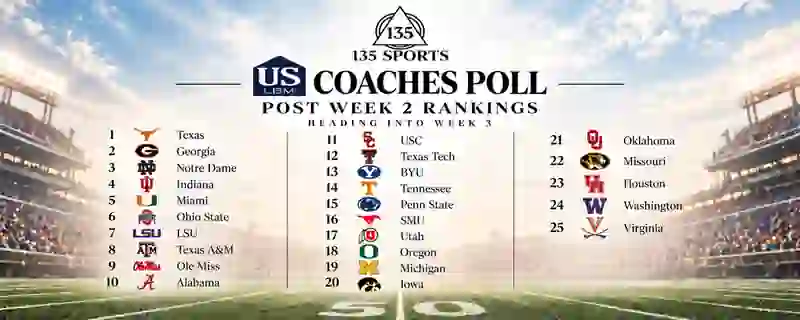
The differences become more interesting farther down the board, where Texas A&M sits eighth, Oregon remains eighteenth, Michigan ranks nineteenth, Oklahoma falls to twenty first, Washington remains ranked at twenty fourth, and Virginia holds the final position at twenty fifth. Florida dropped from the Coaches Top 25 entirely, while several teams outside the ranking continued receiving meaningful support from voters. (AFCA) Those differences show why comparing the two human polls remains useful, because neither voting group is required to interpret the same evidence in exactly the same way. Coaches bring a different professional perspective to the ballot while still operating inside a system that compresses many individual judgments into one ordinal Top 25. The result is another respected national reference point, but it should not be confused with a model whose primary objective is estimating current predictive team strength.
135 Sports College Football Top 30, 2026 v0.12
The 135 Sports Top 30 is designed to answer a narrower question than either national poll, because the governing object is predictive team strength rather than resume quality or voter consensus. Each team begins from an audited opening view, then governed game evidence updates that view as the season develops and more information becomes available. A win against a heavily overmatched opponent does not automatically create the same information as a surprising road performance, and a close result between teams already viewed as peers does not automatically demand dramatic movement.
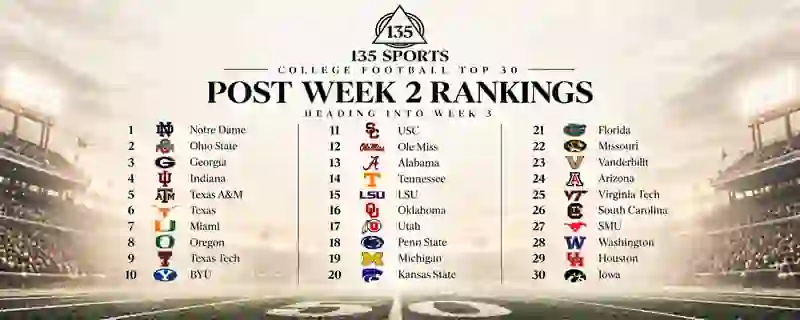
That distinction is clear immediately when comparing the current 135 board with the public polls, because Texas remains sixth even after beating Ohio State while Notre Dame holds the top position. Texas received credit for confirming that it belongs among the elite teams, but the result did not suddenly transform the Longhorns into a fundamentally different predictive object than the one that entered the game. Oregon moves sharply downward because two consecutive performances challenged the strength of its opening profile, while Alabama, Texas A&M, Kansas State, Virginia Tech, and several others rise because their accumulated live evidence strengthened the case for them.
The model also treats extreme margins cautiously, because a massive score against an overmatched opponent should not create unlimited information about future team strength. Adjacent rankings can therefore be much closer than the integers make them appear, and a difference between thirteenth and fourteenth should never be interpreted as proof that a meaningful competitive tier separates those teams. The current public board intentionally shows rank, movement, record, public poll comparisons, and qualitative reasoning without exposing internal model states or presenting unsupported precision as part of the product.
From 2026 v0.10 to 2026 v0.11: tightening the strength model
The board readers saw last week used methodology 2026 v0.10, which gave us a governed public starting point for evaluating how the system behaved once actual games began replacing preseason assumptions. During this week's successor work, 2026 v0.11 became an intermediate live successor while we continued examining whether the underlying strength estimation process could perform better under historical testing. The research focused on whether individual game results were changing predictive strength in a way that improved future game expectations rather than simply making the current rankings look more intuitive.
The successor testing showed that the 2026 v0.11 strength engine performed better in the historical out of sample testing used for the review, which justified preserving that engine as the predictive foundation for the next stage of work. That conclusion was not built around Oregon, Texas, Alabama, LSU, or any other team on the current 2026 board, because current placements were not allowed to become the target of the research process. The point was to improve the predictive foundation on historical evidence before asking a separate question about how that foundation should appear in the published ranking.
The v0.11 work also exposed an important distinction that had been too easy to blur, because improving the predictive engine was not identical to improving how the public ranking absorbed accumulated live evidence. A model can become better at estimating what one game says about team strength while the published board still remains too anchored to its opening state after multiple games have been played. Once that distinction became clear, the next research question was no longer whether to rewrite the strength engine again, but how the public ranking should transition from launch belief toward the complete set of governed season evidence.
From 2026 v0.11 to 2026 v0.12: giving live football more authority
The purpose of 2026 v0.12 was to preserve the stronger predictive foundation while directly testing how the published board should respond as more real football enters the evidence set. We evaluated a small collection of complete publication approaches across historical seasons and selected one using a decision rule established before the current 2026 board was examined. The historical differences among those approaches were small, so we treated the result as a disciplined selection under a rule frozen in advance rather than evidence that one approach would dominate every alternative in every future season.
The second correction involved the evidence window itself, because the published state should reflect the complete set of governed results admitted through the snapshot cutoff rather than overemphasizing only the newest Saturday. Week 1 evidence does not disappear simply because Week 2 produced newer information, and every admitted result continues contributing to the current assessment as the season develops. That distinction matters for teams such as Michigan, because the win over Oklahoma supplied meaningful positive evidence while the earlier Western Michigan performance remained part of the same evaluation rather than being erased by recency.
The result is the first board where the opening view still matters while live football has enough authority to produce meaningful movement after multiple games. Oregon can fall because the evidence challenged an elite starting profile, Washington can fall despite winning because the performance itself was much weaker than expected, and Texas can remain behind several teams because beating Ohio State narrowly confirmed an existing peer relationship rather than creating a separate achievement bonus. The method remains predictive rather than resume based, but the published ranking now responds more directly to what the season has actually taught us.
135 Sports College Football Top 30: Team by Team Explanation
The explanations below describe the public reasoning behind each placement without reproducing the protected mechanics that generate the final board. They focus on the direction and quality of the evidence, the context surrounding each result, and the reason a team's ordinal position changed or remained stable. Movement is measured against the published Post Week 1 board, because that is the prior public ranking readers actually saw before this week's update.
The ranking should also be read as a current ordered view rather than a collection of rigid competitive tiers, because nearby teams can be separated by very little internally. A team can improve its underlying profile while staying in the same position, and another team can fall despite winning when the performance supplies weaker information than expected. Those distinctions matter throughout the board, especially in the crowded middle and near the final Top 30 cutoff.
1. Notre Dame, unchanged
Notre Dame remains first because its early results have reinforced an opening profile that already belonged among the strongest teams in the country. The Wisconsin performance supplied meaningful positive information, while the Rice result confirmed that the Irish could dominate an opponent they were already expected to control. Nothing in the accumulated evidence has created a stronger reason to move another team ahead of Notre Dame at this point.
2. Ohio State, unchanged
Ohio State remains second because the one point road loss at Texas did very little to separate two teams the model already viewed as elite peers. The result counts as a loss in the standings, but predictive strength cares about what the performance revealed relative to the quality of the matchup. Ohio State therefore stays near the top because the broader evidence still supports an elite team, even after the first defeat.
3. Georgia, unchanged
Georgia remains third because its first two games have largely confirmed the strength of an already elite opening profile. The dominant Western Kentucky result showed Georgia handling an overmatched opponent exactly as a top team should, without creating a reason for unlimited additional credit. The Bulldogs stay third because the evidence supports continuity near the top rather than a major revision in either direction.
4. Indiana, up one
Indiana moves to fourth because the Hoosiers continue producing results that support a high level predictive profile early in the season. Their dominant Week 2 performance added another confirming result, while negative movement elsewhere on the board created room for Indiana to advance. The rise therefore reflects both a stable strength case and the relative nature of an ordered ranking.
5. Texas A&M, up two
Texas A&M rises two places because the win over Arizona State produced one of the stronger positive model signals from Week 2. The result strengthened the current assessment of Texas A&M's underlying team strength rather than simply adding another victory to the record. That evidence was strong enough to move the Aggies past several teams whose early results were either more neutral or materially negative.
6. Texas, unchanged
Texas remains sixth even after beating Ohio State because the model already viewed the two programs as closely matched elite teams entering the game. A one point victory therefore confirmed that Texas belongs in the same competitive neighborhood rather than creating an automatic reward for defeating a famous opponent. The Longhorns strengthened their case without receiving a separate resume bonus, which is why the result supports the ranking without forcing Texas to first.
7. Miami, up one
Miami rises one position because its early season results continue reinforcing a strong predictive profile rather than challenging the opening view. The Hurricanes have shown the ability to separate from weaker opponents while carrying forward the positive information created by their earlier road performance. Oregon's decline also changes the order around Miami, allowing the Hurricanes to move upward without requiring an exaggerated interpretation of Week 2.
8. Oregon, down four
Oregon falls four places because the first two games have both provided evidence that challenged an exceptionally strong opening profile. The loss at Oklahoma State was especially important because the performance was substantially weaker than what the model expected from Oregon entering that matchup. The Ducks still remain inside the top ten because the broader strength case has not disappeared, but live evidence now carries enough authority to create a meaningful correction.
9. Texas Tech, unchanged
Texas Tech stays ninth because the Red Raiders remain strong enough to hold their place while the early evidence has not demanded a major upward revision. The road win at Oregon State preserved a good overall profile, but the performance did not separate Texas Tech from the teams immediately ahead of it. The unchanged ranking therefore reflects stability rather than a conclusion that the first two games provided no useful information.
10. BYU, up one
BYU moves into the top ten because the win over Arizona added another positive result to a solid early season profile. The Cougars did not require a dramatic revaluation, but their accumulated evidence improved enough to move ahead of USC in the current ordering. The movement remains modest because the ranking sees confirmation and improvement rather than a complete change in the underlying team.
11. USC, down one
USC falls one place because the complete early season evidence has been good rather than uniformly strong relative to expectation. BYU's improving profile was enough to move ahead, while USC still remains firmly inside the upper portion of the current board. The change therefore reflects the ordering between nearby teams rather than a broad negative judgment about USC's overall strength.
12. Ole Miss, unchanged
Ole Miss remains twelfth because the Rebels continue carrying a strong overall profile without producing evidence that requires a major move. The Charlotte win confirmed that Ole Miss could dominate an overmatched opponent, while the earlier Louisville result remains part of the complete evaluation. The combination keeps the Rebels securely inside the upper portion of the board without separating them enough to move higher.
13. Alabama, up three
Alabama rises three positions because the road victory at Kentucky delivered one of the stronger positive signals anywhere on the current board. The performance strengthened the model's view of Alabama beyond where the Crimson Tide began the season, while several nearby teams either stayed flat or moved backward. This is exactly the kind of accumulated evidence that the current methodology is designed to recognize more clearly as the season develops.
14. Tennessee, unchanged
Tennessee remains fourteenth even though the road win at Georgia Tech materially strengthened the Volunteers' current profile. The performance was clearly positive, but Alabama also surged into this portion of the board and absorbed one of the available upward positions. Tennessee therefore improves internally while remaining in the same ordinal spot, which illustrates why movement and underlying strength change are not identical concepts.
15. LSU, unchanged
LSU stays fifteenth even though its accumulated early season evidence has strengthened the Tigers considerably relative to their opening position. The Louisiana Tech win supported an already improving profile, while the earlier result against Clemson supplied the more significant information about LSU's current strength. The ranking remains unchanged because the teams immediately above LSU also carry strong cases, not because the Tigers failed to improve.
16. Oklahoma, down three
Oklahoma falls three places because the road loss at Michigan supplied meaningful negative information about the Sooners' current predictive strength. The opening result did little to challenge the prior view, which made the Michigan performance much more important once stronger opposition arrived. Alabama's rise and Oklahoma's own negative update combine to move the Sooners from the edge of the top fifteen into sixteenth.
17. Utah, unchanged
Utah remains seventeenth even though the decisive win over Arkansas produced a meaningful positive signal for the Utes. Their underlying profile improved, but movement from Alabama and Oklahoma rearranged the teams around them in a way that largely offset that progress ordinally. The unchanged number should therefore be read as a stable place in the ordering, not as evidence that Utah's evaluation stayed exactly the same.
18. Penn State, up one
Penn State rises one position because the Nittany Lions have accumulated steady positive evidence through their first two games. The road win at Temple was not a transformative result, but it added another useful piece of information without introducing a major concern. Michigan's more volatile opening stretch then created enough separation for Penn State to move ahead by one place.
19. Michigan, down one
Michigan falls one position even though beating Oklahoma was one of the stronger individual results from Week 2. The ranking does not erase the earlier Western Michigan performance, which had already challenged the strength of Michigan's opening assessment before the Oklahoma game arrived. The second result repaired much of that damage, but the full evidence window still leaves Penn State slightly ahead in the current ordering.
20. Kansas State, up six
Kansas State makes the largest positive move on the board because both admitted games strengthened the Wildcats' case relative to their starting position. The decisive win over Washington State added another meaningful positive result and gave the model substantially more reason to believe in the current team. That accumulated evidence was strong enough to carry Kansas State through a crowded portion of the board and into twentieth.
21. Florida, up one
Florida rises one position because its early results have generally supported a stronger predictive profile than the opening board suggested. The Campbell win was dominant, although the model already expected Florida to control that matchup and therefore did not treat the score as unlimited new information. The overall evidence remains positive enough for a modest move upward while keeping Florida behind the stronger risers immediately above it.
22. Missouri, up three
Missouri climbs three positions because the road win at Kansas provided a meaningful positive signal against a credible opponent. The result strengthened the Tigers' current profile more than another routine win over an overmatched team would have done. That improvement was sufficient to move Missouri through several teams whose early evidence had been weaker or more mixed.
23. Vanderbilt, down two
Vanderbilt falls two places because its first two performances were somewhat less convincing than the model expected from those matchups, while several nearby teams produced stronger positive evidence. The Commodores remain inside the Top 30 because the broader team profile still supports inclusion among the strongest teams in the current field. Their lower position reflects the accumulated information from two games rather than a judgment based only on the final records.
24. Arizona, down one
Arizona falls one position because its early evidence now contains both a positive opening signal and a road loss at BYU. Those results pull in opposite directions, leaving the Wildcats with a mixed profile rather than a clear case for upward movement. Arizona still belongs inside the Top 30, but stronger performances elsewhere move the Wildcats slightly lower this week.
25. Virginia Tech, up five
Virginia Tech rises five positions because the Hokies have meaningfully strengthened their case through both admitted games. The convincing victory over Old Dominion followed another performance that already pointed upward, creating one of the strongest positive revisions in this part of the board. The move reflects accumulated evidence rather than one isolated Saturday, which is why Virginia Tech climbs from the edge of the ranking into twenty fifth.
26. South Carolina, up one
South Carolina rises one place because the first two results have been somewhat better than the opening profile implied. The Towson victory added another positive data point without creating the kind of information that would justify a dramatic leap through the board. The Gamecocks therefore receive a modest upward adjustment while remaining near the lower portion of the Top 30.
27. SMU, down three
SMU falls three positions because its early performances have supplied less positive information than several teams around it. The Florida State result did not create enough separation to protect the previous ranking, while stronger evidence from Kansas State, Missouri, and Virginia Tech changed the order around the Mustangs. SMU remains inside the Top 30 because the broader strength case is still credible despite the relative decline.
28. Washington, down eight
Washington makes the largest negative move because the narrow win over Utah State was substantially weaker than the model expected from the Huskies in that matchup. A predictive ranking has to distinguish between the final result and the information contained in the performance, which means a victory can still weaken the current strength assessment. The broader profile keeps Washington inside the Top 30, but the accumulated live evidence supports a major downward correction.
29. Houston, unchanged
Houston remains twenty ninth because the emphatic Week 2 victory helped without completely erasing the questions created by the earlier performance. The model expected Houston to control a much weaker opponent, so the size of the win did not automatically translate into a massive upward revision. The combined evidence therefore leaves Houston near its previous position while other teams around the cutoff move more substantially.
30. Iowa, down two
Iowa falls two positions because the three point win over Iowa State was less convincing than the model expected from the matchup. The Hawkeyes retain enough underlying strength to stay inside the Top 30, but the latest evidence softened the current profile rather than strengthening it. Kansas State and Virginia Tech both generated stronger upward cases, which leaves Iowa holding the final position on this week's board.
Disclosure
Disclosure: The 135 Sports College Football Top 30 is an independent editorial and analytical ranking produced by 135 Sports. It is not affiliated with, sponsored by, endorsed by or produced in partnership with the NCAA, the College Football Playoff, the Associated Press, the US LBM Coaches Poll, any conference, university, athletic department, sportsbook or other organization referenced in this article. Team names, logos and other trademarks belong to their respective owners and are referenced for identification and editorial commentary. Scores, schedules, poll positions and other public football information are drawn from publicly available sources and are believed accurate as of publication. The rankings represent 135 Sports’ assessment of present team strength and may change as new information becomes available. They are not intended as gambling, financial or investment advice. For the live rankings and future updates, visit 135sports.com or go directly to 135sports.com/college-football-rankings.



Explore 135 Sports: Weekly Rankings · CFB Top 30